Question
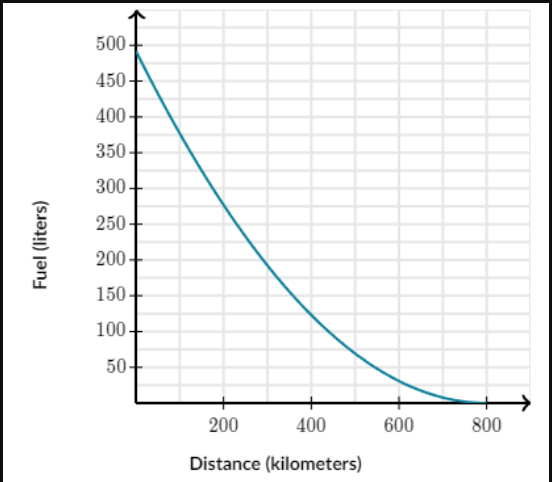
The graph below describes the fuel remaining in a delivery truck's tank (in liters) as a function of distance (in kilometers) is graphed.
1. The graph below describes the fuel remaining in a delivery truck's tank (in liters) as a function of distance (in kilometers) is graphed.
**
a. What is the y-intercept and what does it represent in this situation?
b. What is the approximate average rate of change between the 100th and the 400th kilometer?
c. What is the approximate average rate of change between the 400th and 600th kilometer?
d. How do the answers in b and c compare? What is going on
Bids
Overall Details:
0 expert/s bid on this question
Answers
No answer provided for this question
Related Questions


